- 3 Big Scoops
- Posts
- Microsoft, Google Beat Q4 Estimates
Microsoft, Google Beat Q4 Estimates
PLUS: China's manufacturing shrinks again
Bulls, Bitcoin, & Beyond

Market Moves Yesterday
S&P 500 @ 4,924.97 ( ⬇️ 0.06%)
Nasdaq Composite @ 15,509.90 ( ⬇️ 0.76%)
Bitcoin @ $42,910.60 ( ⬇️ 0.07%)
Hey Scoopers,
Happy Wednesday! Here’s today’s breakdown 👇
👉 Big Tech earnings begin
👉 China’s manufacturing sector is under pressure
👉 Ethereum is poised to gain
Microsoft and Google Beat Estimates
Microsoft shares are trading 1.2% lower in pre-market trading today, following its results for fiscal Q2 of 2024 (ended in December).
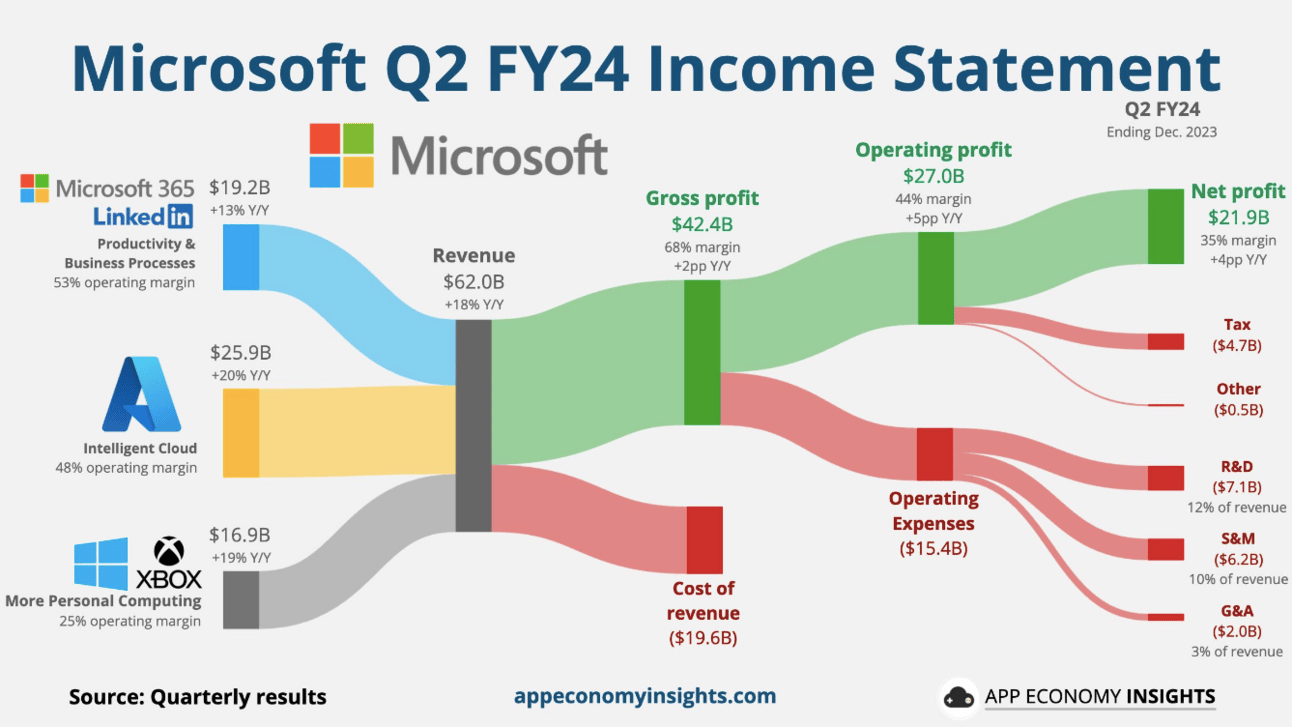
In Q2, Microsoft reported:
👉 Earnings of $2.93 per share vs. estimates of $2.78 per share
👉 Revenue of $62 billion vs. estimates of $61.1 billion
While sales were up 18%, earnings soared by 33% for the tech giant in Q2. Moreover, the company forecast revenue between $60 billion and $61 billion in Q3, compared to estimates of $60.93 billion.
Here’s what drove Microsoft sales in Q2:
Intelligent Cloud revenue was up 20% at $25.88 billion
Azure revenue grew by 30%
Productivity and Business Processes sales were up 13% at $19.25 billion
Personal Computing revenue was up 19% at $16.9 billion
Alphabet Slumps 6%
Shares of Alphabet, the parent company of Google, are down almost 6% in pre-market at the time of writing as the company announced Q4 results and reported:
👉 Earnings of $1.64 per share vs. estimates of $1.59 per share
👉 Revenue of $86.31 billion vs. estimates of $85.33 billion
Alphabet’s Google Cloud sales stood at $9.19 billion vs. estimates of $8.94 billion, while YouTube ads raked in $9.2 billion vs. estimates of $9.21 billion.
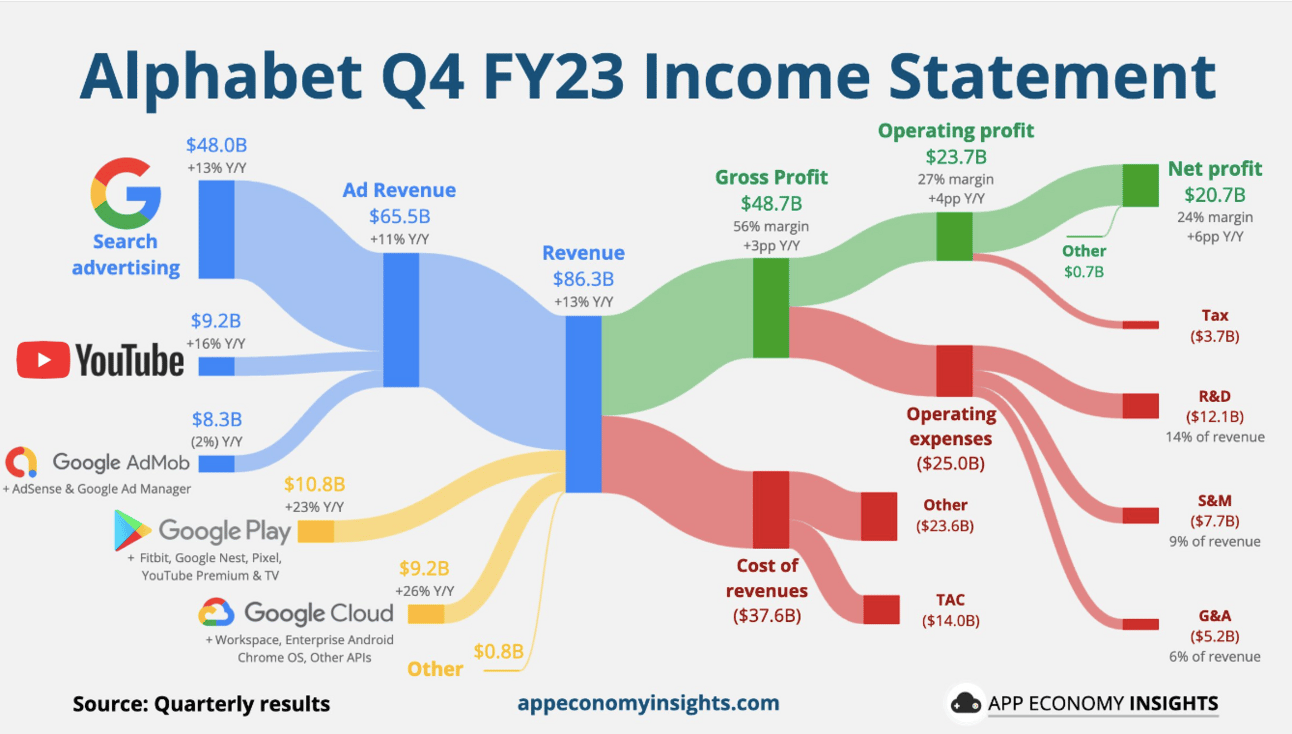
Google’s traffic acquisition costs in the quarter stood at $13.9 billion, lower than estimates of $14.1 billion.
Alphabet’s revenue grew by 13% year over year in Q4, the fastest since early 2022.
While Alphabet surpassed Wall Street estimates in Q4, the stock is trading lower as investors are worried about slowing ad sales.
Facebook Ads sales are growing at a much faster pace, while TikTok is gaining rapid traction due to its rising popularity in the U.S. and other key markets.
Google Cloud remains a crucial driver of the top line for Alphabet, with Q4 sales rising 26% compared to the year-ago period.
The business is now reporting consistent profits with an operating income of $864 million, compared to a loss of $186 million last year.
China’s Manufacturing Activity Shrinks In January
China’s manufacturing activity contracted for the fourth consecutive month in January.
Its official manufacturing purchasing managers index rose to 49.2 in January from 49 in December. A PMI reading of more than 50 indicates an expansion in activity, while a reading below the level points to a contraction.
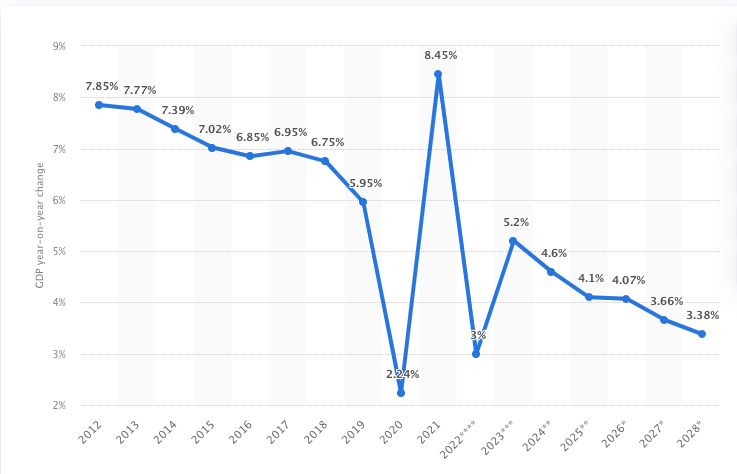
China’s GDP Growth Is Slowing
Weakness in manufacturing was driven by sectors such as construction and real estate.
China’s slowing growth has forced the country’s policymakers to embark on a journey of monetary easing.
Last week, the People’s Bank of China reduced the amount of liquidity banks are required to hold as reserves, increasing the capacity for lenders to extend loans and spur spending for households and businesses.
Ethereum On the Move?
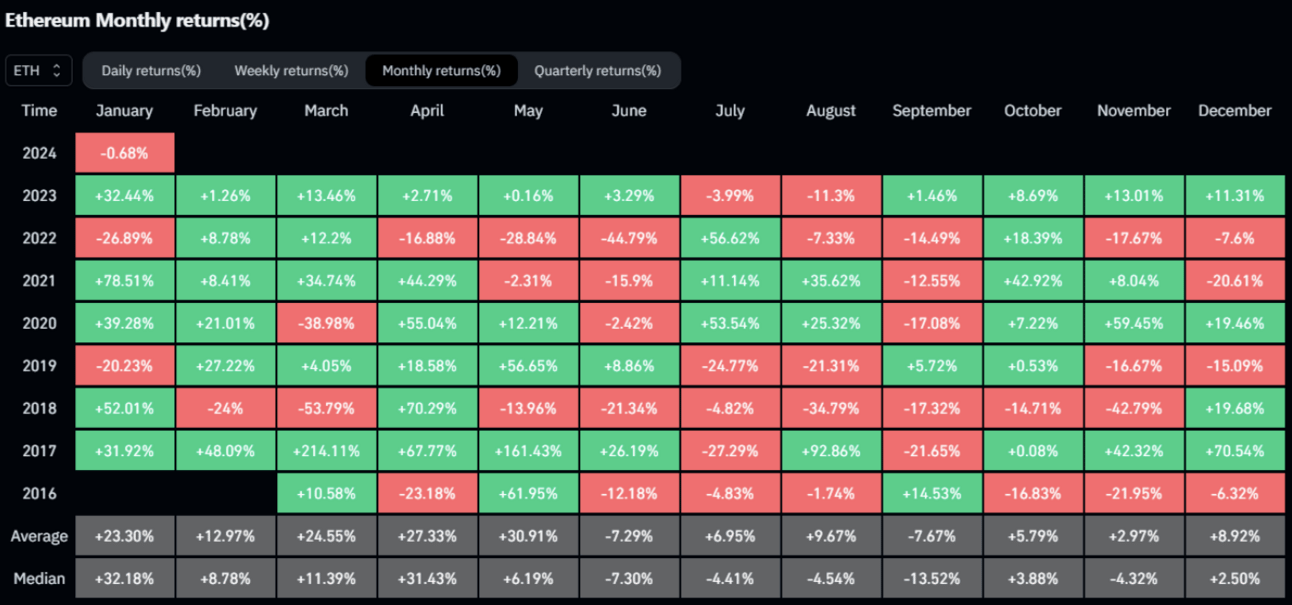
Historically, Ethereum prices have moved higher in the first five months of the year.
The chart below shows that the best months for Ethereum are between January and May, where average returns range between 13% and 31%.
Here’s what could drive ETH prices in the near term:
The approval of spot Ethereum ETFs of exchange-traded funds
The highly anticipated Dencun upgrade
Falling ETH supply on centralized exchanges may boost demand
Valued at $281 billion by market cap, Ethereum is the second-largest cryptocurrency globally. In the last 12 months, ETH prices have soared by 47%.
Headlines You Can’t Miss!
IMF is bullish on India
U.S. judge voids Elon Musk’s $54 billion payout
Samsung’s operating profit falls by 34.7%
Starbucks disappoints in Q4
Germany seizes 50,000 BTC in copyright case
Chart of The Day
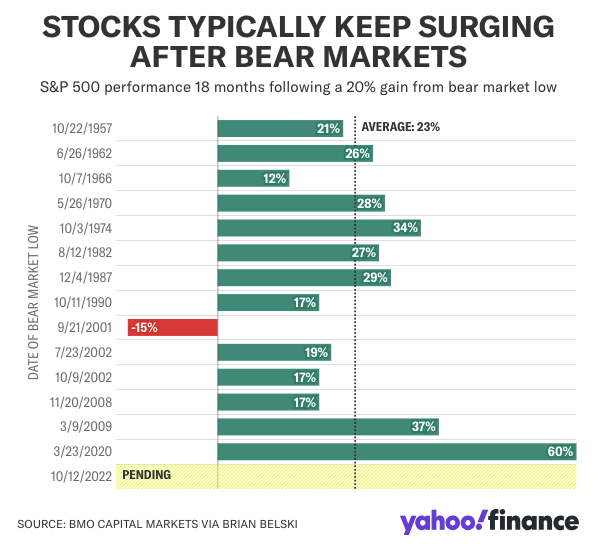
The S&P 500 index closed 20% above its 2022 bear market price low on June 8, 2023. Generally, a 20% gain from the bottom indicates the start of a new bull market.
On average, the S&P 500 has gained an average of 23% in the 18 months following the 20% threshold.
The S&P 500 index closed at 4,294 on June 8. So, if we apply the 18-month average gain, the index should trade around 5,280 by December 2024.
DISCLAIMER: None of this is financial advice. This newsletter is strictly educational and is not investment advice or a solicitation to buy or sell assets or make financial decisions. Please be careful and do your own research.
